Are you a fan of matrix visual in Power BI? If you are as I am, I always struggle to get the correct totals and get something else instead of the totals it can be average. After a lot of research and going over different community posts, finally we have found 3 common scenarios that can elevate your matrix to the next level.
To start with, I am using Sample Superstore data. Let's first explain the 3 different scenarios that we will tackle -
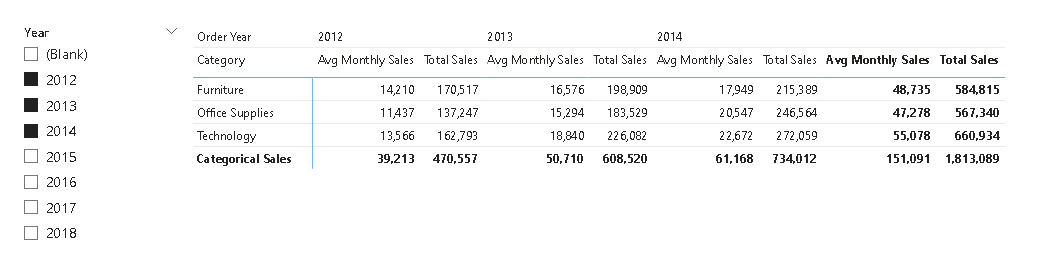
- We would like to show both Total Sales and Average Monthly Sales across different categories and different periods.
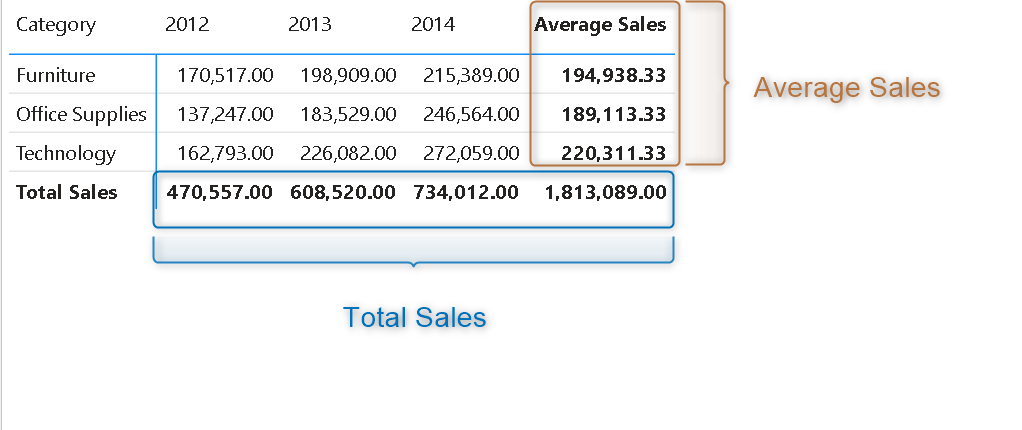
- We would like to show the Average Sales in the row subtotals and Total Sales in the column subtotals.
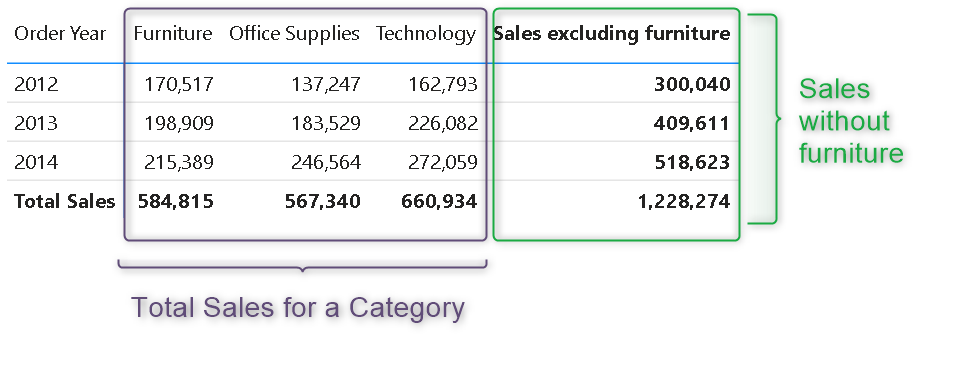
- Last and the most interesting scenario is to show the Total sales excluding the furniture sales in the row subtotals and total sales in the column subtotals.
Let's start by getting the correct totals in a matrix. Generally, if use basic Sum, Average... functions in your measures then most likely you will get the incorrect totals. But why? Very simple answer would be Power BI isn't smart enough to recognize the level on which Sum, Average... should be calculated. How to get it right then? Use of iterator functions such as SUMX, and AVERAGEX.. to know more about it in detail we would recommend having a quick read on one of the most popular blogs on our website- Wrong totals in Power BI.
Once you have the totals corrected we will start with the first scenario. So, we will pull Order Year (calculate column) in the columns and Category in the rows. For every year we would like to see Average Monthly Sales next to the Total Sales. We would need a different measure that will help to land into this condition if there is one value provided for the year then show the total sales otherwise the average sales are calculated with AVERAGEX.
Avg Monthly Sales =
IF (
    HASONEVALUE ( 'Date'[Year] ),
    [Total Sales],
    AVERAGEX (
        SUMMARIZE ( 'Date', 'Date'[MonthNumber] ),
        [Total Sales]
    )
)
We have utilized HASONEVALUE to define this condition. HASONEVALUE checks if a particular column has a single value if not then it returns FALSE. We have taken advantage of the FALSE scenario of HASONEVALUE. We would recommend, to refer the DAX Guide for HASONEVALUE to know in detail what else can be achieved with this function.
Easy peasy lemon squeezy!! 😂 Moving to the second scenario, now we are looking for a similar setup as the first scenario but this time we only need the average sales on the row subtotals and total sales as the column subtotals. To achieve it with a single measure we will take benefit of basic SWITCH and ISINSCOPE functions.
Correct Subtotals =SWITCH (
    TRUE (),
    ISINSCOPE ( SampleSuperstore[Category] )
        && ISINSCOPE ( SampleSuperstore[Order Year] ), [Total Sales],
    ISINSCOPE ( SampleSuperstore[Category] ), [Average Sales],
    ISINSCOPE ( SampleSuperstore[Order Year] ), [Total Sales],
    [Total Sales]
)
To calculate Average Sales we are using this measure
Average Sales =
CALCULATE (
    AVERAGEX ( VALUES ( SampleSuperstore[Order Year] ), [Total Sales] )
)
What is going on here 😵💫??? Okay, let's debunk the DAX step by step. To understand the Correct Subtotals measure wewill first need to understand the function ISINSCOPE. In simple words, ISINSCOPE allows us to detect if a particular field is in the row or column of a visual. To understand ISINSCOPE in detail we would recommend visiting DAXGUIDE
Correct Subtotals DEBUNKED =
SWITCH (
    TRUE (),
    ISINSCOPE ( Row_Name )
        && ISINSCOPE ( Column_Name ), [Total Sales], -- show all inner values
    ISINSCOPE ( Row_Name ), [Average Sales],         -- row subtotal
    ISINSCOPE ( Column_Name ), [Total Sales],        -- column subtotal
    [Total Sales]                                    -- grand total
)
Too much playing with DAX for the day!! Let's do one last scenario, we would like to show the Order year in the row and Categories in the column. Row subtotals should represent the Sales without the furniture category sales and column subtotals should show the total sales.
Correct Subtotals excluding furniture =
SWITCH (
    TRUE (),
    ISINSCOPE ( SampleSuperstore[Category] )
        && ISINSCOPE ( SampleSuperstore[Order Year] ), [Total Sales],
    ISINSCOPE ( SampleSuperstore[Order Year] ), [Sales excluding furniture],
    ISINSCOPE ( SampleSuperstore[Category] ), [Total Sales],
    [Sales excluding furniture]
)

)
It's too confusing now. Okay, let's create a debunk measure for it then. We are using the same ISINSCOPE function which will return TRUE if a particular field is used in the row or column in a visual (matrix in this case). Otherwise, it will return FALSE.
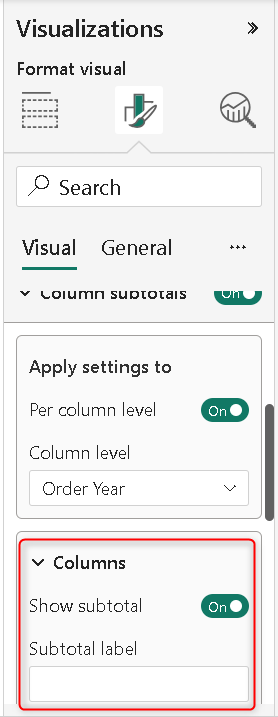
Pro tip: Using all these measures is fun but beware that by default matrix will only show totals as the label for the column and row subtotals. To change it select the matrix and go to the Column Subtotal and Row Subtotal to change it. Also, if you do not want to provide a label just click on the Subtotal label and provide a space.
Isn't it amazing?? In this blog, we have only explored 3 scenarios but there can be more such scenarios. Most of such scenarios can be tackled with a slight tweaking to the measures provided above. We would strongly recommend before you try these measures have a basic understanding of HASONEVALUE and ISINSCOPE.
Subscribe
One practical Power BI tip per week. No spam.
Comments
Prefer not to sign in? Share your thoughts on LinkedIn I reply fastest there.