A lot of Power BI setups feel solid until you have to depend on them. On the surface, everything looks in place, reports are running, numbers are there, and users are happy(sometimes). But underneath, it often works more like a set of disconnected pieces than a system. The moment something breaks, whether it’s a failed refresh or a report behaving differently, you realize there’s no easy way to understand what happened or fix it quickly.
That gap doesn’t come from bad reports. It comes from everything around them being handled manually. Most teams focus on building the model and getting the visuals right, but very little attention goes into control, monitoring, or visibility across the setup. That missing layer is what starts to hurt as things scale, and that’s exactly where Power BI APIs come in.
In this post
We’ll focus on the points where most Power BI setups start to struggle once things scale:
- Why refresh starts failing even when nothing obvious has changed
- Why you don’t really know which reports and datasets actually matter
- What could break when you make a change, and how to find out before it does
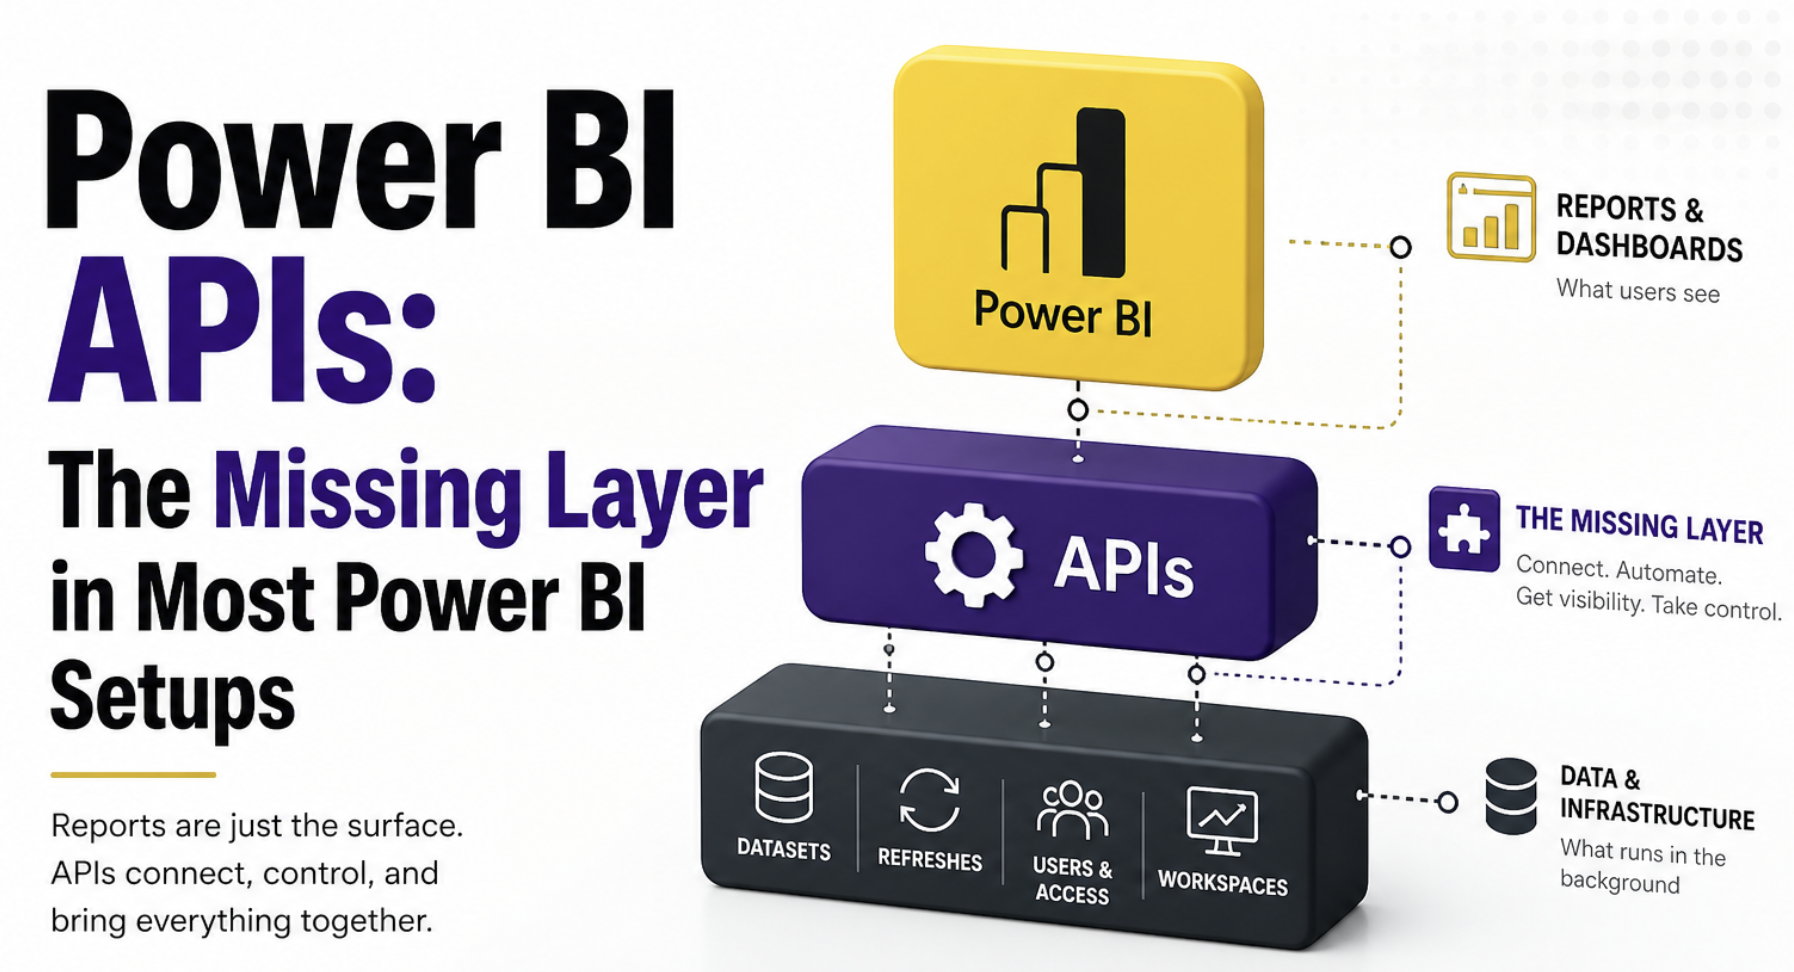
Power BI doesn’t stop at reports
Most of the effort in Power BI goes into building the model and getting the report and visuals right. That’s the visible part, and naturally, where most of the focus stays. But once things start to grow, the problems don’t come from there. They come from everything around it. How refresh is managed, how changes are tracked, and how you know what’s actually being used.
That’s the part most setups don’t really control. And that’s where APIs start to make sense. Not as an advanced feature, but as the layer that helps you manage what sits behind the reports. We will cover the three pain points in this post, but there is so much that you can achieve with APIs
This is also where APIs started to stand out when I was experimenting with them recently. I had mentioned this briefly in a recent newsletter, but the more I worked through it, the clearer the gap became. So enough of talking, let's get our hands dirty.
When refresh starts failing for no clear reason
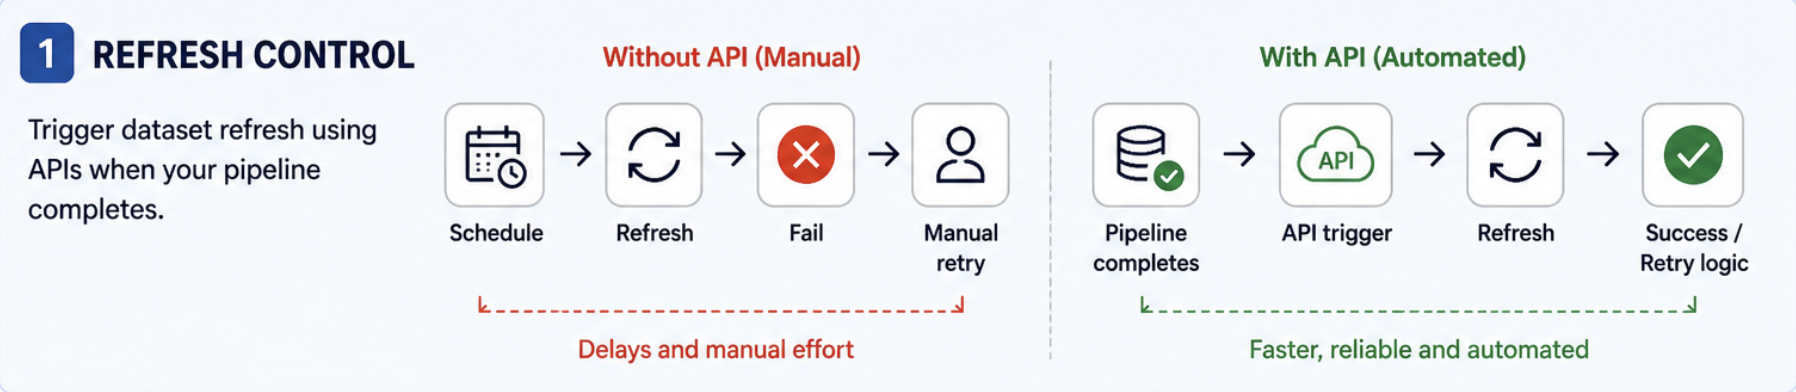
Scheduled refresh works until datasets start depending on upstream jobs or other datasets. One process finishes late, another refresh starts too early, and sometimes the source data isn’t even ready. The model keeps refreshing on schedule anyway, completely unaware of upstream failures, and you end up manually retrying things that should have worked in the first place.
How can you implement it in the real world
- Pick one dataset that often fails or runs at the wrong time.
- Identify what needs to finish before it refreshes, this could be a file load, pipeline, or another dataset.
- Move the refresh trigger out of the schedule and into your upstream process. For example, once your pipeline, file load, or dataflow completes, trigger the dataset refresh using Power Automate, Azure Data Factory, or a simple script.
- Place this trigger as the final step in your upstream process so it only runs after everything completes successfully.
- Add a basic check for refresh status and retry once if it fails.
If you’re starting out, Power Automate is usually the easiest way to set this up without worrying about API details.
Pro tip: Don’t try to move everything to API-driven refresh at once. Start with one unstable dataset. Also, avoid triggering too many refreshes in parallel; capacity limits will hit you faster than you expect.
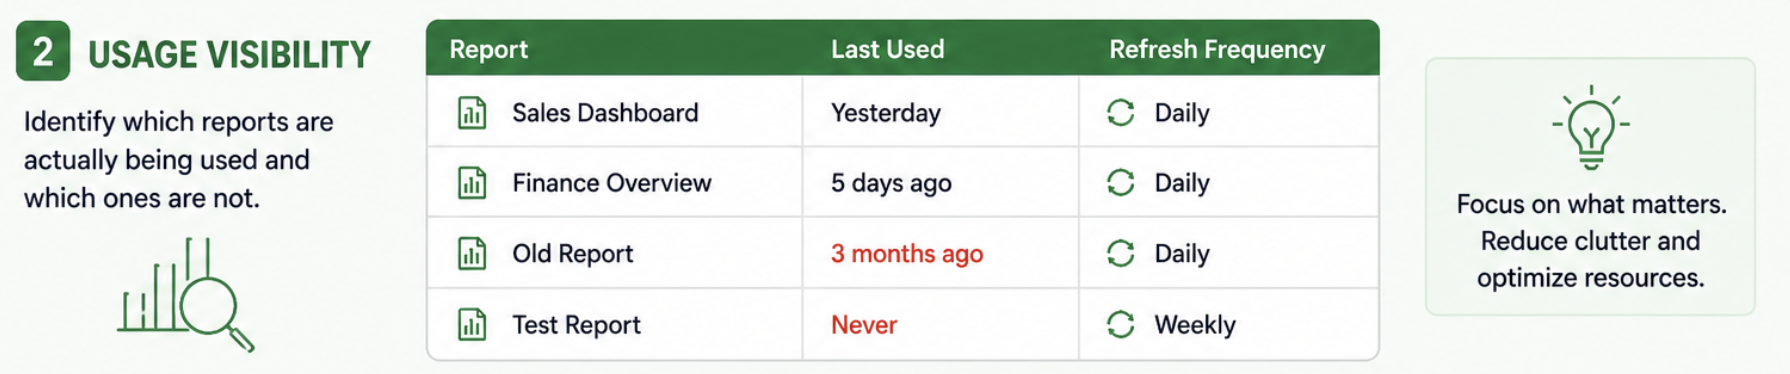
You don’t really know what’s being used
Most teams think they have a good sense of what’s important in their Power BI setup. There are a few “known” reports, some datasets everyone talks about, and a general assumption of what’s being used.
But when you actually try to validate it, things don’t add up. Some reports haven’t been opened in months but are still refreshing every day. Datasets that fail occasionally, but no one notices because the report isn’t used often. And then there are a few critical ones that people depend on, but you only find out how important they are when something breaks.
Without proper visibility, everything ends up being treated the same. You spend time maintaining things that don’t matter, and miss the ones that actually do.
How can you implement it in the real world
- Start by pulling a list of your workspaces, datasets, and reports using Power BI APIs. If you're new to this, the easiest way is to use Power Automate and call the built-in Power BI actions like “Get workspaces” or “Get reports”.
- Store the output of these calls in a simple table, this could be an Excel file, a SharePoint list, or even a database if you already have one.
- Capture basic fields like report name, workspace name, dataset name, and last activity where available.
- Add dataset refresh history using the API so you can see how often each dataset runs and whether it fails.
- Build a simple Power BI report on top of this data to compare usage vs refresh frequency.
Pro tip: Usage data is never perfect. Don’t treat it as the absolute truth. Use it to spot patterns, not make one-time decisions like deleting reports immediately.
What breaks if I change this?
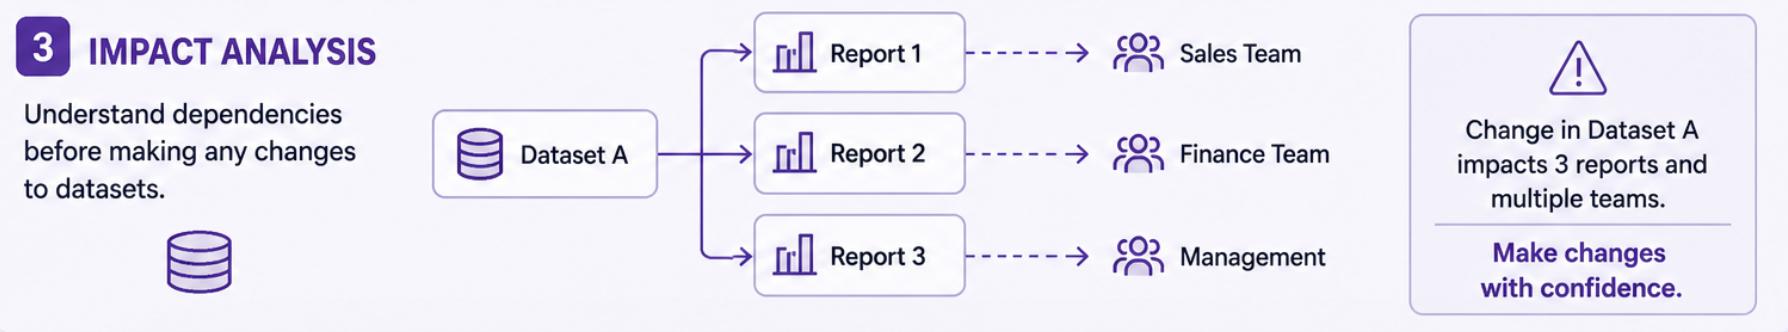
A dataset change looks small until it breaks multiple reports downstream. Without dependency visibility, every change involves guesswork. Now, guess if you have a stack of 100 datasets and reports, checking them one by one will be cumbersome.
How can you implement it in the real world
- Pick the dataset you’re planning to change.
- Use Power BI APIs to pull a list of workspaces, datasets, and reports. If you're starting out, Power Automate is the easiest option using actions like “Get workspaces” and “Get reports”.
- From this data, match reports to your dataset. In most cases, this means looking for reports that are built on that dataset within the same workspace or connected via a shared dataset.
- Store this mapping in a simple table with dataset name, report name, and workspace.
- Before making the change, review this list and identify the reports that matter most.
- After the change, validate only these reports instead of checking everything manually.
Pro tip: Don’t aim for a perfect dependency map in the beginning. Even a partial view is enough to avoid most surprises. Also, if you’re using shared datasets across workspaces, this becomes much more important. That’s usually where hidden dependencies show up.
Where can I start?
If you haven’t worked with APIs before, the easiest way to begin is to pick one use case and take it end to end. Don’t try to connect everything at once. Just focus on getting one flow working properly.
A simple way to approach this:
- Start by pulling a small set of data using the API, like datasets, reports, or refresh history
- Store it somewhere simple so you can reuse it
- Build a quick view on top of it so you can actually see what’s going on
- Then add one action, like triggering a refresh or flagging something that needs attention
That’s enough to move from a manual setup to something more controlled.
What not to do in the first go
- Don’t try to automate your entire Power BI setup
- Don’t aim for a perfect model or complete coverage
- Don’t overcomplicate things with scripts if you’re just starting out
- Don’t wait until everything is defined before trying it
Start small, get one piece working, and build from there. That’s usually what makes the difference.
Other areas where APIs can help
The use cases above are usually where most teams start, but APIs don’t stop there. Once you begin working with them, you start noticing other gaps that are harder to manage manually. Things like ownership, monitoring, and workspace visibility don’t feel urgent at first, but they become important as your setup grows and more people start depending on it.
For example, pulling ownership details into one place avoids the usual back and forth when something breaks. Tracking refresh failures removes the need for manual checks. Listing workspaces and understanding access gives you a clearer picture of how your environment is structured. These are not always the first things to implement, but they are often the ones that make a setup easier to manage over time.
Closing thought
Most Power BI setups don’t struggle because of bad reports. They struggle because everything around the reports is left to manual processes. It works for a while, but as things grow, small gaps start turning into recurring issues.
APIs don’t fix everything in a go, but they change how you deal with those gaps. Instead of reacting to problems one by one, you start putting simple controls in place. That’s usually where things begin to feel different.
Comments
Join the discussion below (GitHub login required), or share your thoughts on LinkedIn . I’m most active there.