
Measuring BI adoption used to be relatively straightforward. Most consumption happened through reports, so report views, active users, and usage trends gave us a reasonable picture.
That's becoming harder to trust. Analytics is increasingly reaching people without them ever opening a report, which means falling report usage doesn't necessarily mean falling adoption.
So if report usage is no longer enough, what would I actually build to understand BI adoption across an enterprise? That's the implementation problem I want to work through here.
Inside this article
- Why report usage no longer tells the whole story?
- Building the foundation without creating more admin
- Connecting usage across Power BI, automation, and AI
- When 12 activities are really just one use
- Is adoption falling or simply moving?
- What I'd actually start with tomorrow?
Start With the Analytical Product
Before collecting any usage data, I need to decide what I'm actually measuring adoption of. For this solution, I'd define an analytical product as a business-facing analytics capability built for a specific purpose, regardless of how people access it. Product ABC isn't the Power BI report or the semantic model behind it. Those are the technical pieces used to deliver it.
One capability, delivered in different ways.
One business-facing analytical capability
This gives us a much more stable level to measure. Reports can be replaced, workflows can be added, and new ways of consuming analytics can appear without starting a completely new adoption story. That is why, for the rest of this setup, Product ABC becomes the thing I'm measuring and not any individual report behind it.
Build the Foundation Once
Once Product ABC becomes the thing I'm measuring, I need somewhere to register it and connect the technical pieces behind it. In a mature setup, I'd treat this as governed metadata, not another spreadsheet or documentation page someone has to keep updating.
I'd keep the Product Registry in the data platform itself. In a Databricks environment, for example, I could have a small analytical_products table containing the Product ID, name, owner, audience and status. A second product_artifacts table would then map the reports, semantic models, workflows and other artifacts back to that Product ID.
The important part is the relationship: one Product ID becomes the common link between the analytical product and everything used to deliver it.
Product ABC
Active
The harder question is how to keep this without turning it into another inventory the BI team has to maintain. I wouldn't manually register every report or semantic model. Technical metadata such as artifact IDs, names, workspaces and lineage should be collected automatically from the platforms wherever possible. The stable Artifact ID then connects what the platform discovers to the business context we've assigned in the Product Registry.
That also changes how new artifacts are handled. If a new report appears but isn't connected to a Product ID, it can simply show up as Unclassified. Instead of asking someone to remember to update the registry every time something changes, we only need to review the exceptions.
So the split of responsibility becomes quite simple: The platform discovers the technology. The BI team governs the business meaning. Confluence or other documentation can still hold the richer story around Product ABC like its purpose, definitions, decisions and supporting context. But the metadata needed by the adoption solution stays structured and queryable in the data platform.
Bring the Usage Data Together
With the Product Registry in place, I'd set up a small scheduled process to collect usage from each platform. The aim isn't to build one complicated integration, but to give every source the same route into the adoption setup.
For Power BI, I'd start with the activity or audit logs and load the useful records into a powerbi_usage table. If Product ABC is also consumed through a workflow, I'd bring its run history into a separate workflow_usage table. AI usage can follow the same pattern later. Each source keeps its own table, so we don't lose the detail or force very different types of activity into the same structure too early.
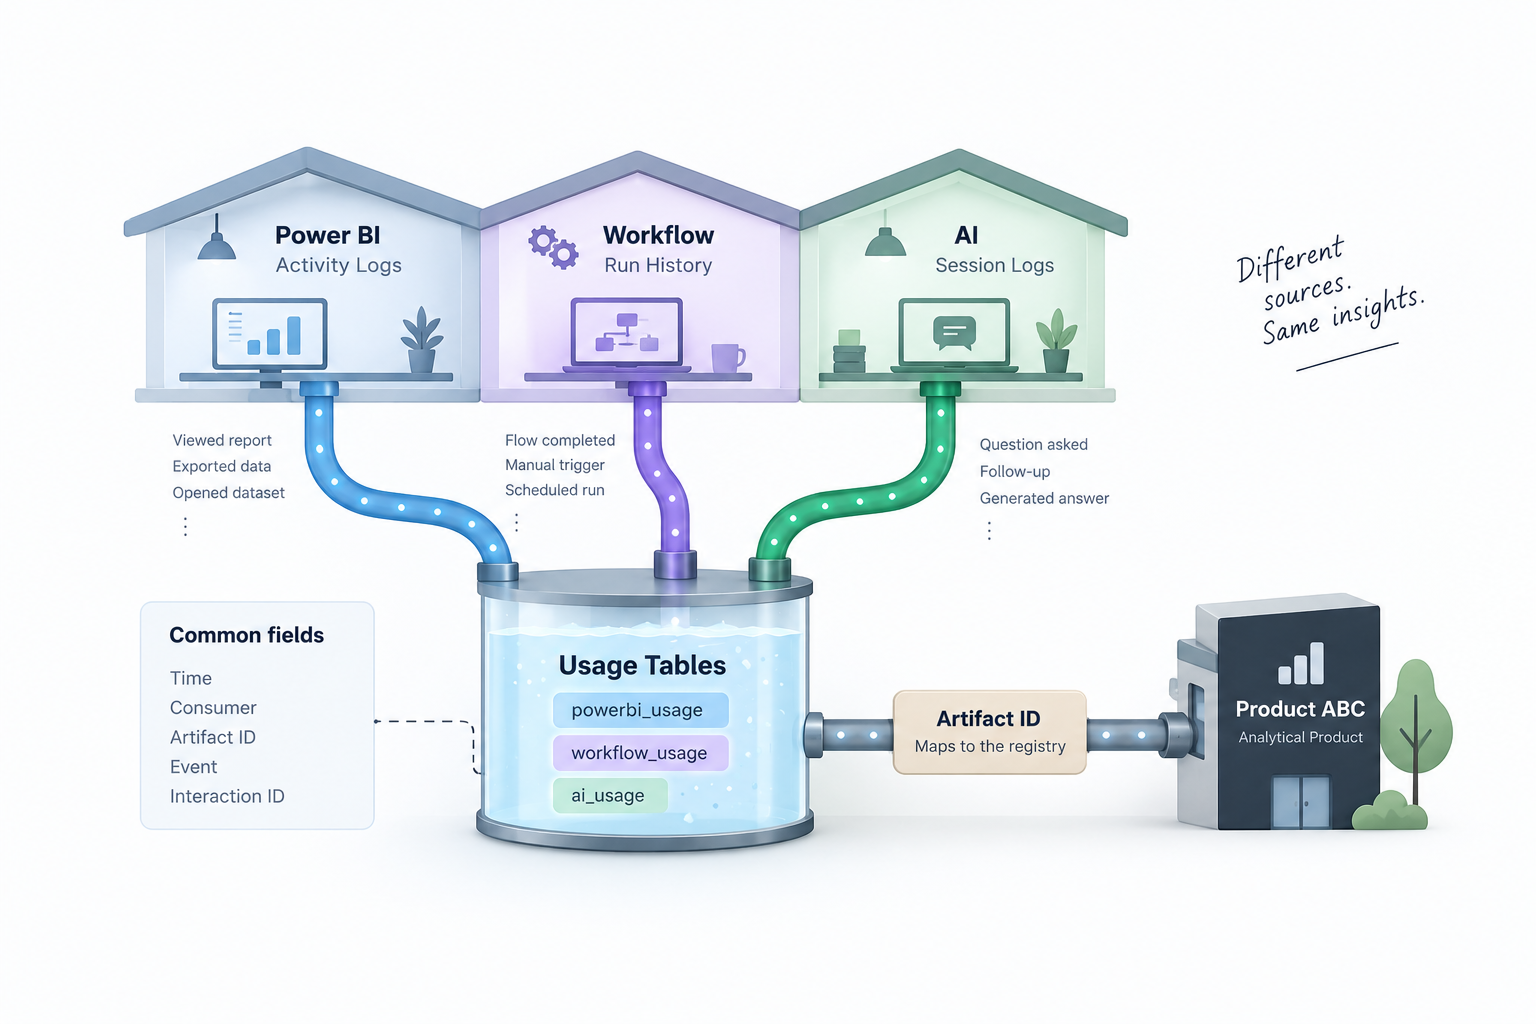
What matters is capturing a few common fields wherever possible: when it happened, who or what consumed it, which artifact was involved, what happened, and an ID for the request or session if one exists. The Artifact ID then connects that activity to the Product Registry.
I'd also keep this process incremental. Once yesterday's activity has been loaded, the next run should only collect what is new. That keeps the process lightweight and means the adoption view can refresh without someone exporting logs or updating files manually.
At this stage, we have something useful: a continuously growing history of how Product ABC is being accessed across different channels. But we still have one problem to solve. What should actually count as one instance of consumption?
Decide What One Use Actually Means
Once the usage data is coming in, I'd create one more table before connecting anything to the final Power BI model. Let's call it product_consumption. This table would have one row for each interaction I actually want to analyse:
product_consumption
3 interactions
09:02
AP-001
Power BI
User A
Report Viewed
8271
09:14
AP-001
Workflow
User B
KPI Delivered
8272
10:03
AP-001
AI
User C
Question Answered
8273
The important work happens when populating this table. For Power BI, a report view might already be close enough to one interaction and can be loaded directly. For a workflow, I'd use the workflow run ID to combine all the steps from the same run into one event. For AI, I'd use the request or session ID so that the multiple semantic model queries needed to answer one question still create only one row.
I'd build these rules in the scheduled data process we created earlier. The original platform data stays untouched, while product_consumption is rebuilt or updated from it automatically. If we later decide that a particular activity should be counted differently, we change the rule and reprocess the data rather than manually correcting history.
This product_consumption table is what I'd connect to the final Power BI model. I still wouldn't add the different events together or give them artificial weights. Instead, I'd keep Channel and Event available for analysis so we can see whether Product ABC is being opened directly, delivered automatically, or accessed through AI.
One interaction should mean one use.
Keep the raw activity for evidence. Model only the interaction you actually want to measure.
Build the View Around How Products Are Used
Once product_consumption is ready, I wouldn't overcomplicate the Power BI model. I'd connect it to the Product Registry through Product ID and start with a portfolio view that shows the different ways each product is being consumed.
I'd deliberately keep report use, automated delivery and AI use separate. Putting them into one adoption score would hide exactly the behaviour I'm trying to understand.
The first thing I'd look for is movement between those columns. If report use for Product ABC falls while automated delivery grows, I wouldn't immediately treat that as declining adoption. If every channel is falling, that's a very different signal. And if usage is growing but the number of consumers isn't, I might be looking at heavier use from the same small group rather than wider adoption.
I'd also compare these patterns over a meaningful period rather than reacting to every monthly change. The useful signal is rarely that report views fell 8% last month. It's that over several months, Product ABC has gradually moved from mostly direct report use to a mix of direct and automated consumption.
From there, I'd use the portfolio view to decide where to investigate, not to make the decision for me. A declining product might need to be retired, or it might have a perfectly healthy reason for the change. A product moving heavily toward automation might even tell me that the report itself is becoming less important. That's the value I'd want from this setup.
“Which reports have low usage?”
“Which products are changing, and where is their consumption going?”
If This Needs Weekly Maintenance, We've Already Lost
A setup like this can look great when it launches and quietly become useless six months later. One new report isn't mapped, an owner changes, a workflow gets replaced, and slowly the adoption view stops reflecting reality.
So I'd design for exceptions, not maintenance.
New reports and semantic models should be discovered automatically. Usage should load on a schedule. Anything the system can't place should come to us: an Unclassified artifact, a missing owner, a failed data load, or an active product with no recent consumption.
The BI team should only need to make the decisions automation can't: Is this a new analytical product? Which product does this artifact belong to? Has this product been retired? I'd make those decisions part of the normal release process rather than create a separate adoption-maintenance routine.
That's the standard I'd use for the whole setup:
Don't ask people to keep the system current. Build the system to tell people when it needs them.What I'd Actually Start With Tomorrow
I wouldn't start by trying to track every report, workflow, alert and AI interaction. I'd pick a small group of Power BI products and prove that the setup works first. Here's what I'd do:
Product ID · Name · Owner · Status
Reports · Semantic Models · Power BI IDs
Start with 5–10 products you know well
Report Views · Users · Activity Time · Report ID
Usage · Consumers · Trend
The registry should live in the same data platform where the rest of the adoption data will eventually sit. When discovering reports and semantic models, I'd keep their Power BI IDs so they can still be identified even if names change. And I wouldn't try to map the entire environment at this stage but just enough products to prove the setup works.
When the usage data comes in, the report ID gives me the connection back to the right product. The first Power BI page only needs to show how much each product is being used, how many people are using it, and whether that is changing over time.
Then I'd stop building and actually use the view. Pick a product where usage is falling or behaving differently and see whether the data helps you understand why. If it doesn't, fix that before adding more sources. Once the Power BI setup is useful, add one new way of consuming analytics, such as an automated workflow. Follow the same pattern:
AI can come later when there is enough real usage to make it worth tracking. The first goal isn't to measure adoption across the entire organisation. Start with 5–10 products, prove that the view helps you make a better decision, and then scale what works.
Closing Thought
I've always found adoption to be a slightly vague word in BI. We use it as if there should be one number that tells us whether a solution is adopted or not, but I'm not convinced that number really exists.
Even with everything we've built here, I wouldn't claim that we can perfectly measure BI adoption. There will always be usage we can't see and context the data can't explain. But I think we can get much closer to understanding how our analytical products are actually being used, rather than relying on report views as a proxy for the whole story.
And for me, that's probably the more useful goal. I don't necessarily need a perfect adoption score. I need enough of the picture to know where usage is growing, where it's moving, where it's disappearing, and where I should start asking questions.
Comments
Join the discussion below (GitHub login required), or share your thoughts on LinkedIn . I’m most active there.