One thing that’s interesting about growing Power BI environments is that they slowly start behaving less like reports and more like systems.
It’s a bit like moving from managing a small local store to managing a warehouse network. In the beginning, you can still keep track of things manually. You know which files matter, which reports are heavily used, and where problems usually happen. But once the environment starts growing, things become much harder to track from memory alone.
One of the pressing issues is when a semantic model gets reused somewhere else. Another when workspace starts depending on the same dataset. Refreshes begin overlapping. Old dashboards stay alive because nobody is fully sure who still uses them. And suddenly, the difficult part is no longer building reports. It’s understanding the environment itself.
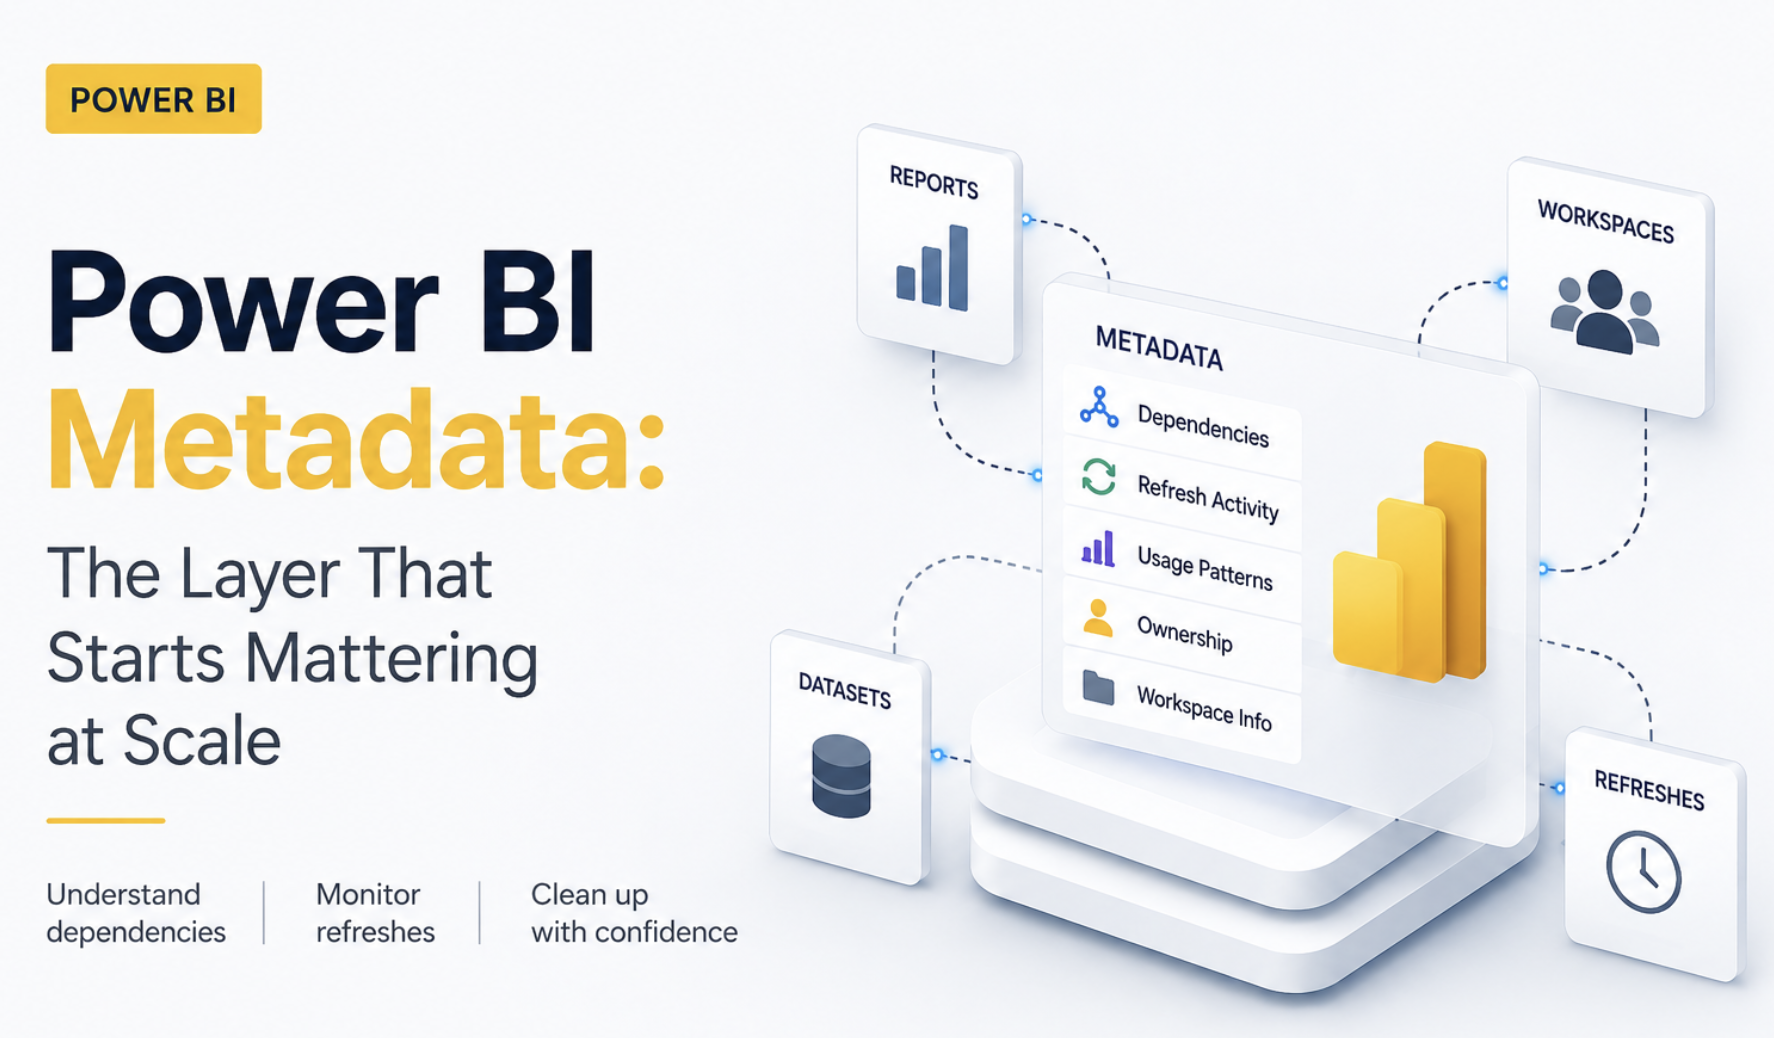
That’s something I touched on briefly in the last BI Bits edition. But the interesting part is that Power BI is already tracking a lot of this information quietly behind the scenes. Dependencies, refresh activity, usage patterns, ownership details, and most of it already exists somewhere inside the platform.
In this blog, I want to go one level deeper into where this metadata actually sits, how APIs expose it, and some practical situations where it becomes genuinely useful for things like dependency tracking, refresh monitoring, and workspace cleanup.
In this blog
- How small operational problems expose hidden complexity in Power BI environments
- Practical examples around deployments, refresh monitoring, and workspace cleanup
- Where APIs start becoming genuinely useful
- Simple ways teams can start building better operational visibility
Why do we care?
Most teams don’t really start exploring metadata intentionally. Usually, they run into it while trying to answer questions that suddenly become difficult. Things like - Can we safely deploy this change? Which reports still depend on this semantic model? Why is this refresh suddenly taking twice as long? Do we still need these workspaces anymore?
And honestly, that’s probably why metadata starts becoming important in the first place.
Because once Power BI environments grow, operating them on assumptions becomes risky. Small backend changes can suddenly impact multiple downstream reports. Cleanup becomes harder because nobody wants to accidentally remove something i.e. business critical. Troubleshooting also changes because the issue is no longer isolated to a single report anymore.
That’s usually the point where Power BI environments stop feeling like a collection of reports and start behaving more like connected systems. And honestly, those situations are probably where metadata started becoming genuinely useful. Not as a technical concept, but as something practical that helps understand what is actually happening behind the scenes.
When Simple Model Changes Start Feeling Risky
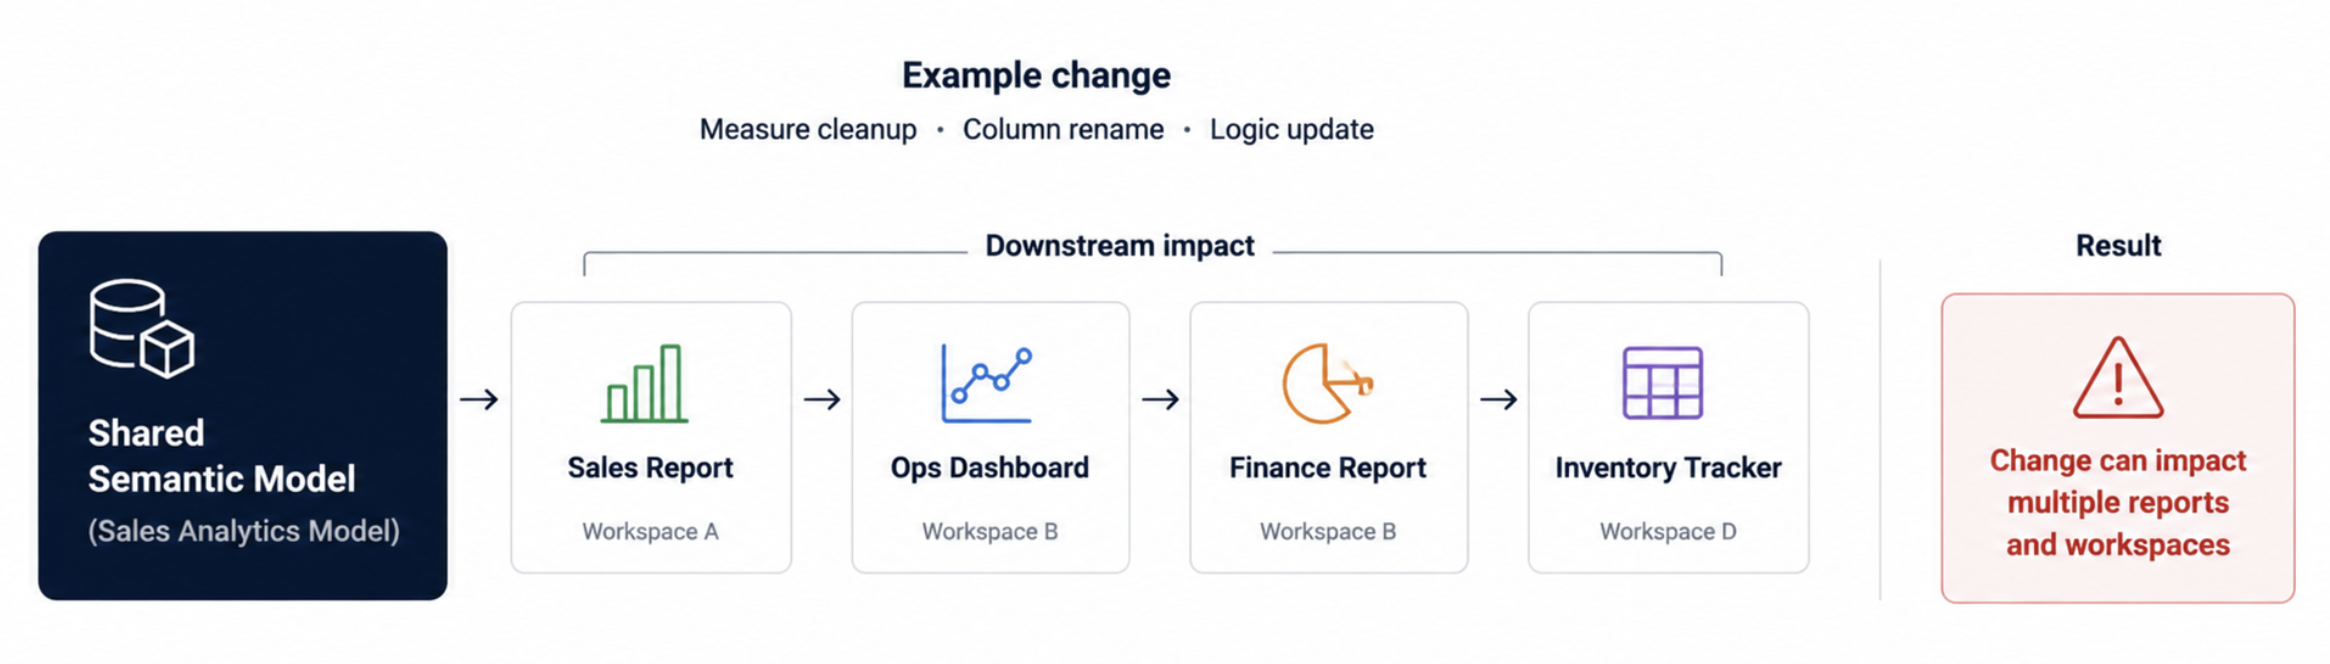
One thing that changes very quickly in larger Power BI environments is how uncomfortable small backend changes start feeling. At the start, a measure change or cleanup or column rename usually feels normal. But once shared semantic models start feeding multiple reports across different workspaces, the same cleanup suddenly carries a very different level of risk.
I’ve seen situations where something looked like a harmless model cleanup suddenly required multiple dependency checks before deployment because nobody was fully sure how far the logic had spread over time. And one of the pain points is you have to go across tons of checks manually.
A semantic model built for one report quietly starts feeding operational dashboards somewhere else. Another team reuses the same dataset because it already contains the logic they need. And after a point, even the original owners stop having complete visibility into where everything is being consumed.
That’s usually where deployments start becoming uncomfortable. The difficult part is no longer making the change itself. It’s confidently understanding the impact before deployment instead of after something breaks.
Where can you start?
One simple habit that helps a lot is stopping shared semantic model changes from being treated like normal report updates.
Before making backend model changes, quickly check Lineage View and note down which reports, workspaces, or downstream dashboards are connected to that model. Even this small step changes deployment discussions because teams stop relying purely on assumptions.
What also becomes useful after a point is building a lightweight dependency inventory through APIs. In our case, even a simple table showing semantic models, connected reports, and workspaces made it much easier to understand deployment impact instead of tracing dependencies manually every single time.
And once that visibility exists, you can start adding lightweight deployment checks as well. For example, flagging highly reused semantic models before deployment or identifying reports that may need additional validation whenever backend logic changes.
Workspace Cleanup Stops Being Simple
Workspace cleanup usually sounds easy in theory. You just remove old reports, archive inactive workspaces, clean up duplicates and standardize the environment a bit. But the difficult part starts the moment someone asks: Are we sure nobody still uses this?
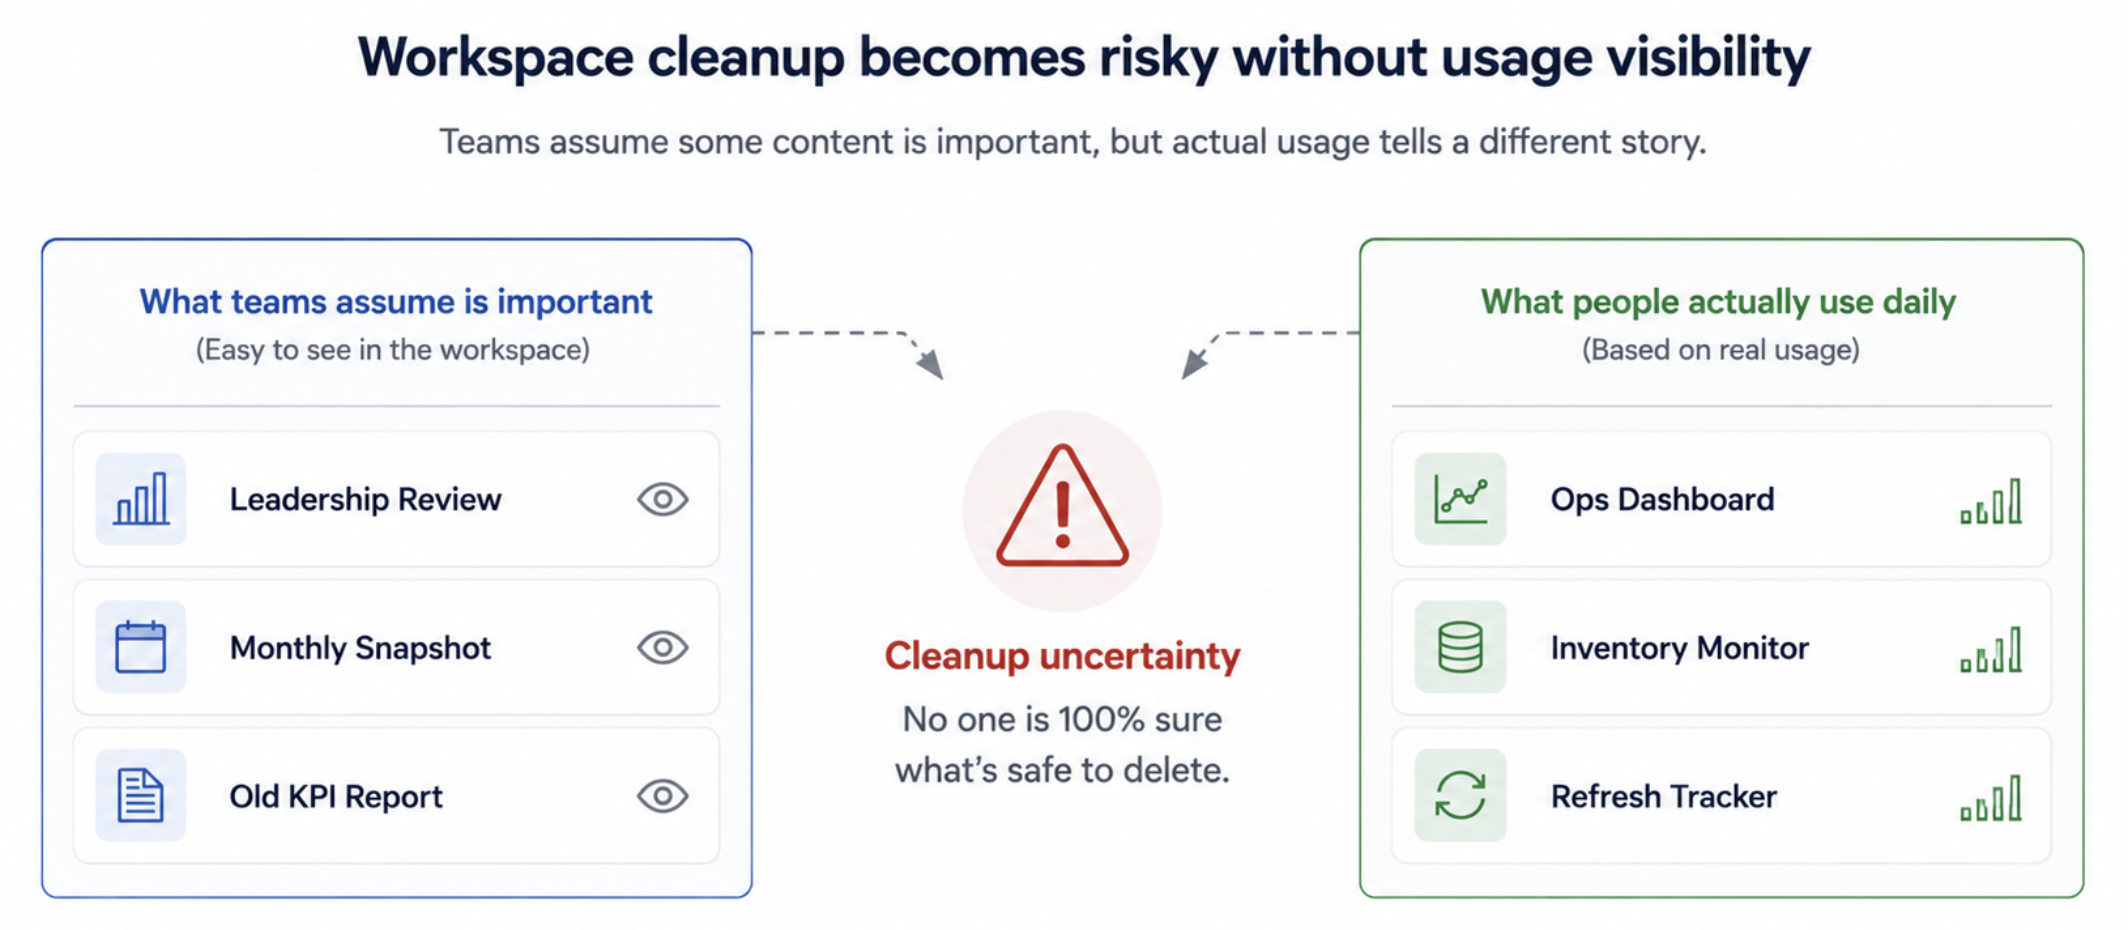
I’ve seen reports that everybody assumed were business critical simply because they were visible and discussed often. But once we checked usage data, some of them barely had any activity. At the same time, smaller operational dashboards quietly ended up being opened every single day without much attention.
That’s usually where cleanup discussions start becoming uncomfortable. Because in larger environments, visibility and actual usage are often two very different things. Older reports stay alive because nobody feels confident deleting them. Duplicate dashboards slowly pile up across workspaces. Ownership becomes blurry over time, especially once original developers move teams or projects evolve.
And honestly, this is where metadata becomes much more useful than people initially expect. Usage visibility, workspace activity, ownership details, and report inventories suddenly become the difference between confident cleanup and simply avoiding the discussion altogether.
Where can you start?
One thing that helped us quite a lot was stopping cleanup discussions from happening directly inside Power BI Service.
Instead, we started pulling workspace inventories, report lists, owners, refresh activity, and usage details through APIs into a separate Power BI monitoring report. That immediately made reviews much easier because you could finally sort, filter, and compare the environment properly instead of opening workspaces one by one trying to understand what was still active.
Even something as simple as sorting reports by last activity or missing owners started exposing dashboards that nobody had really reviewed in a long time.
And once that visibility exists, you can start automating parts of the cleanup process as well. For example, setting up Power Automate flows that notify report owners when dashboards stay inactive for long periods, before eventually archiving or cleaning up older content in a more controlled way.
Refresh Problems Rarely Stay Isolated
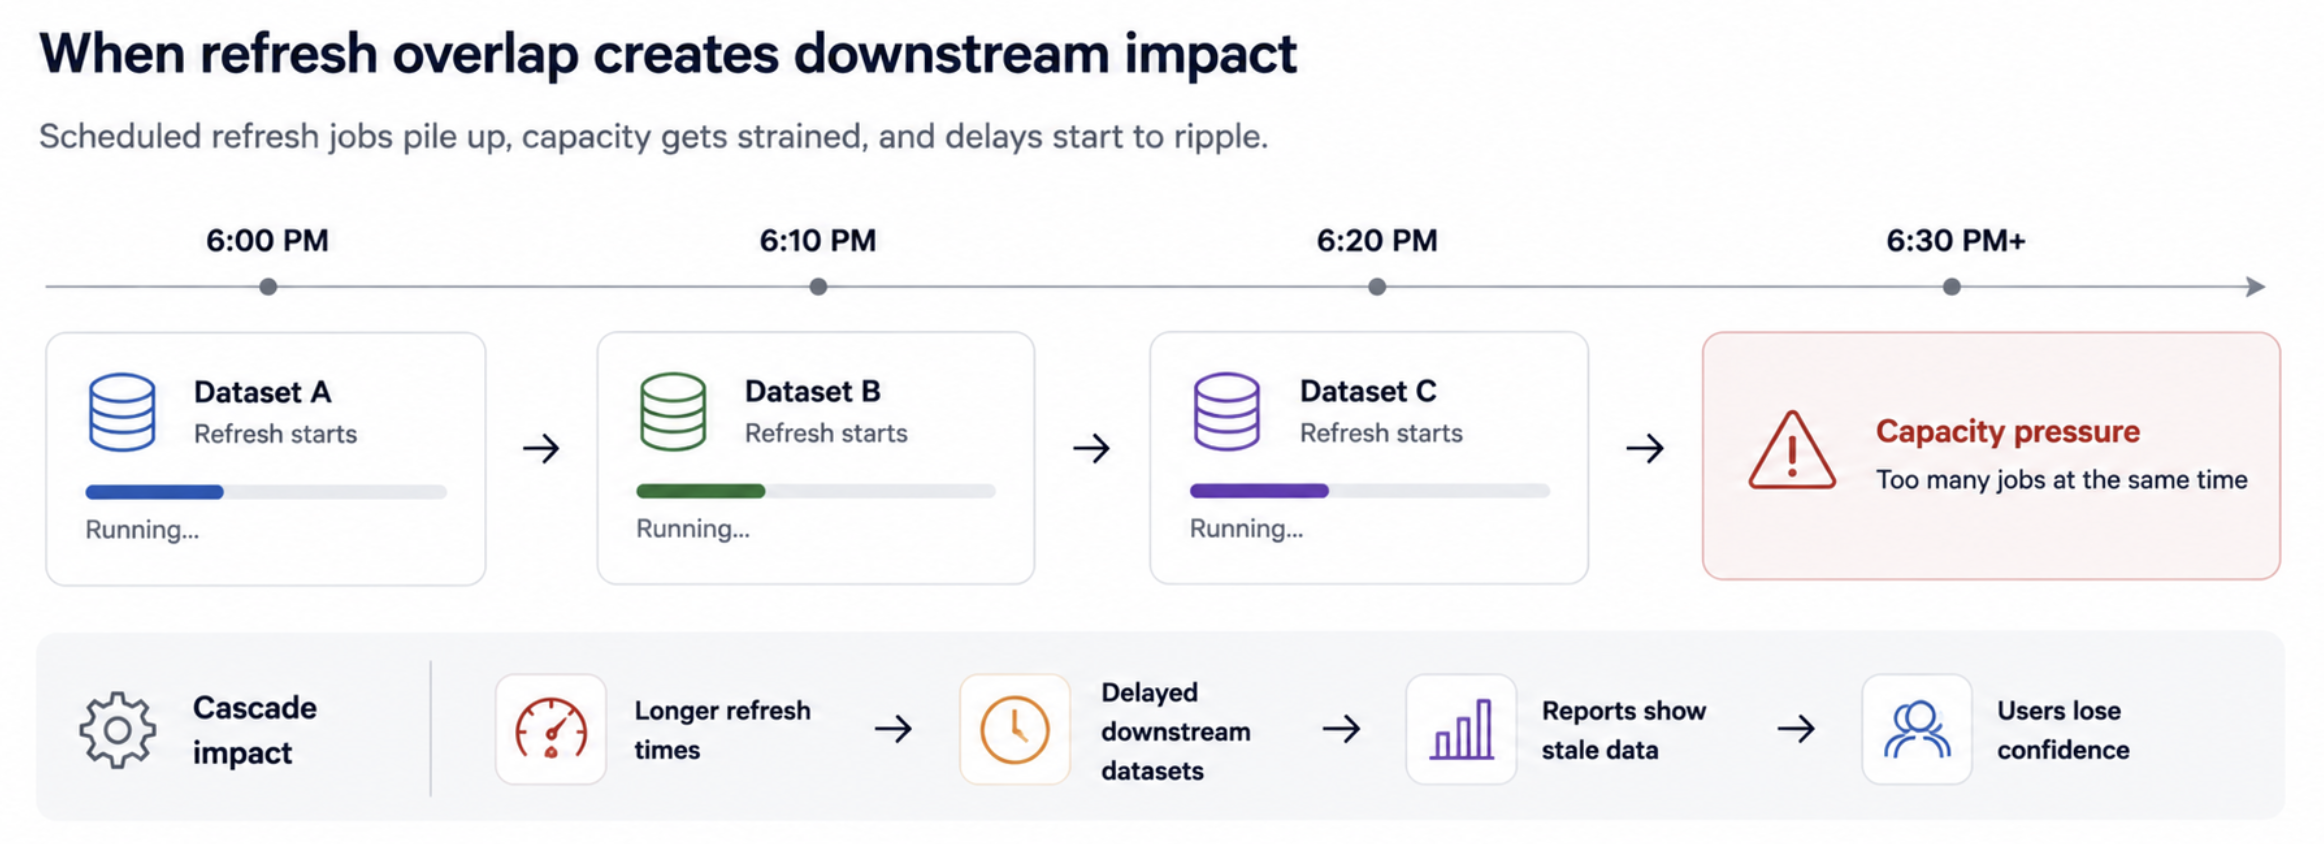
Refresh troubleshooting also changes quite a lot once Power BI environments start growing. In smaller setups, a failed refresh is usually just a report-level issue. You fix the dataset, rerun the refresh, and move on. But once larger semantic models, shared capacities, and multiple scheduled refreshes start overlapping, the impact usually spreads much further than one dashboard.
I’ve seen situations where one long-running refresh quietly affected completely unrelated reporting because capacity was already under pressure in the background. Sometimes the refresh itself was not even failing; it was simply running much longer than expected and slowly creating a chain reaction across the environment. That’s also where refresh troubleshooting becomes much harder manually.
Checking the refresh history dataset by dataset works initially. But after a point, teams start needing visibility into refresh duration trends, repeated failures, overlapping schedules, and which semantic models are consistently consuming the most resources.
And honestly, this is where metadata becomes much more operational than technical. Because the goal is no longer just fixing one failed refresh. It becomes understanding patterns before they start affecting the wider environment.
Where can you start?
Start with one workspace or a small group of important semantic models. Don’t begin with the entire environment. First, use the Power BI REST API to pull the list of datasets in that workspace. Then pull refresh history for each dataset and store the results in a simple monitoring table with fields like workspace, semantic model, refresh start time, end time, status, and duration.
Once you have this, create a small monitoring view in Power BI itself. Even a basic table or trend chart is enough initially. The goal is not to build a full monitoring product from day one. It’s simply to start spotting patterns that are difficult to notice manually.
In our case, things became much easier to identify once refresh durations were visible together in one place. Long-running semantic models, repeated failures, overlapping refresh windows, and unusually heavy refreshes started standing out very quickly instead of being discovered only after users reported issues.
And after a point, this also opens the door for lightweight alerting. For example, triggering notifications when refresh duration suddenly spikes, when critical semantic models fail repeatedly, or when refresh windows begin overlapping too heavily during peak hours.
Pro tip: In larger organizations, some of this visibility already exists within central Power BI admin or platform teams. But what I’ve noticed is that individual BI teams still benefit a lot from having smaller operational views focused specifically on their own semantic models, refresh patterns, deployments, and workspace activity.
Closing Thoughts
One thing I’ve realized over time is that many Power BI problems stop being purely reporting problems after a certain point. The difficult part is no longer building the dashboard itself. It becomes understanding how everything is connected behind the scenes and making operational decisions with confidence.
And honestly, that’s probably why metadata started becoming much more practical for me than I initially expected. Not as a governance concept, but as a way to better understand what is actually happening across the environment before small issues turn into bigger ones.
I also explored this operational side of APIs in more detail in my earlier blog, Power BI APIs: The Missing Layer in Most Power BI Setups, especially around how APIs start exposing visibility that becomes difficult to manage manually from the UI alone.
Comments
Join the discussion below (GitHub login required), or share your thoughts on LinkedIn . I’m most active there.